Over the last 15 years, my collaborators and I have produced many numerical simulations of hurricanes. Many of these are “full-physics” simulations that include physical processes such as surface friction, precipitation, and solar and infrared radiation. All of them were produced with the Weather Research and Forecasting Model (WRF) https://www.mmm.ucar.edu/weather-research-and-forecasting-model.
For some of these, all the model output is stored at the UM Center for Computational Sciences and are available to be downloaded and used for any purpose. The output is in the standard NetCDF format produced by the WRF model. Some of these simulations are described below.
To access the data, contact David Nolan.
Hurricane Nature Run
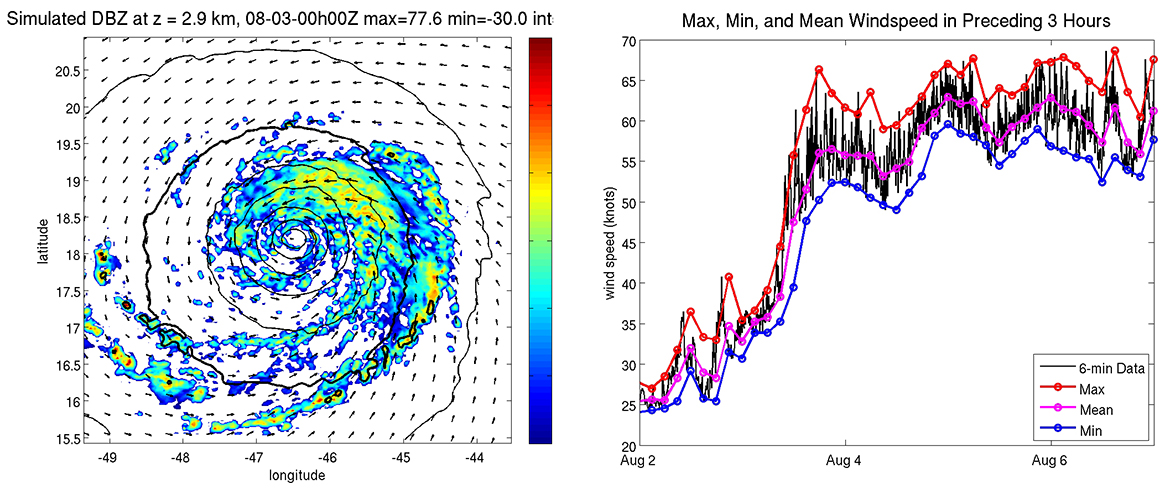
The nature run is a 13-day regionally downscaled simulation of an Atlantic hurricane. It is not a simulation of a hurricane that actually occurred, but rather it is a downscaled simulation of a hurricane that occurs in the global weather nature run produced at ECMWF in 2006. Nonetheless, it has been shown to be quite realistic. The simulation uses an outer domain with 27 km grid spacing and nested, moving grids that follow the storm with 9 km, 3 km, and 1 km grid spacings. All dynamical variables and physical tendencies were saved every 30 minutes on the 27 km, 9 km, and 3 km grids, and every 6 minutes on the 1 km grids. This simulation covers genesis in the East Atlantic, rapid intensification, an eyewall replacement cycle, and recurvature into the North Atlantic.

Related publications:
Nolan, David S., Robert Atlas, Kieran T. Bhatia, and Lisa R. Bucci, 2013: Development and validation of a hurricane nature run using the Joint OSSE Nature Run and the WRF model. J. Adv. Model. Earth Syst., 5, 1-24.
Nolan, David S., Jun A. Zhang, and Eric. W. Uhlhorn, 2014: On the limits of estimating the maximum wind speeds in hurricanes. Mon. Wea. Rev., 142, 2814-2837.
Klotz, B. W., and D. S. Nolan, 2019: SFMR surface wind undersampling over the tropical cyclone lifecycle. Mon. Wea. Rev., 147, 247-268.
Dunion, J. P., C. D. Thorncroft, and D. S. Nolan, 2019: Tropical cyclone diurnal signals in a hurricane nature run. Mon. Wea. Rev., 147, 363-388.
Hurricane Nature Run 2
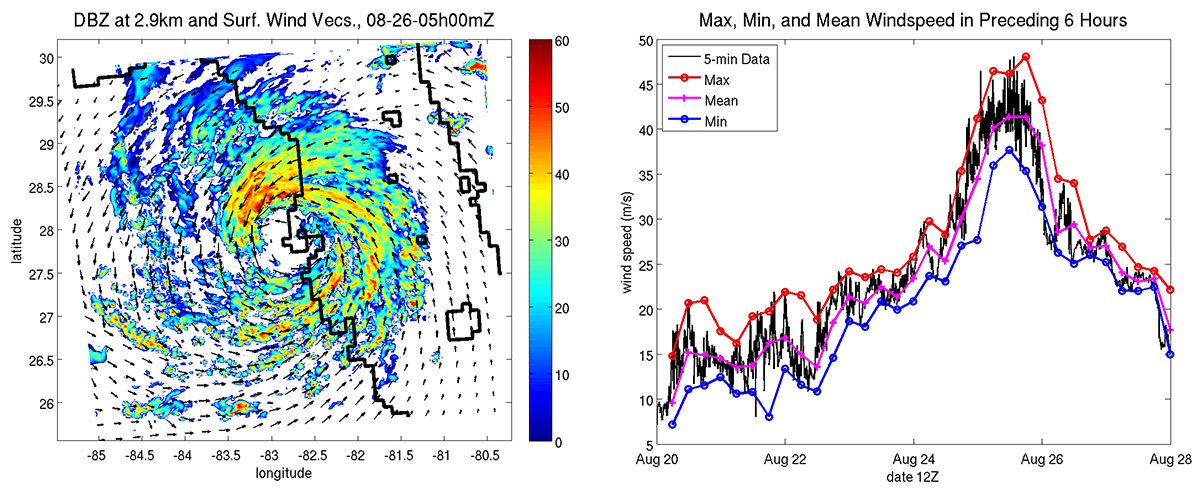
This is a regionally downscaled simulation of a second hurricane produced by the ECMWF nature run. In this case, the cyclone forms between Haiti and Cuba, moves across Cuba, intensifies in the Gulf of Mexico, and then makes landfall near Tampa. This simulation used 3 domains with 9km, 3km, and 1km grid spacing. The data is available every 30 min, 30 min, and 5 min, respectively.

Related publications:
Nolan, D. S., and C. A. Mattocks, 2014: Development and evaluation of the second hurricane nature run using the Joint OSSE nature run and the WRF model. Preprints, 31stAMS Conference on Hurricanes and Tropical Meteorology, San Diego, California.
Klotz, B. W., and D. S. Nolan, 2019: SFMR surface wind undersampling over the tropical cyclone lifecycle. Mon. Wea. Rev., 147, 247-268.
Ideal3 and Ideal5
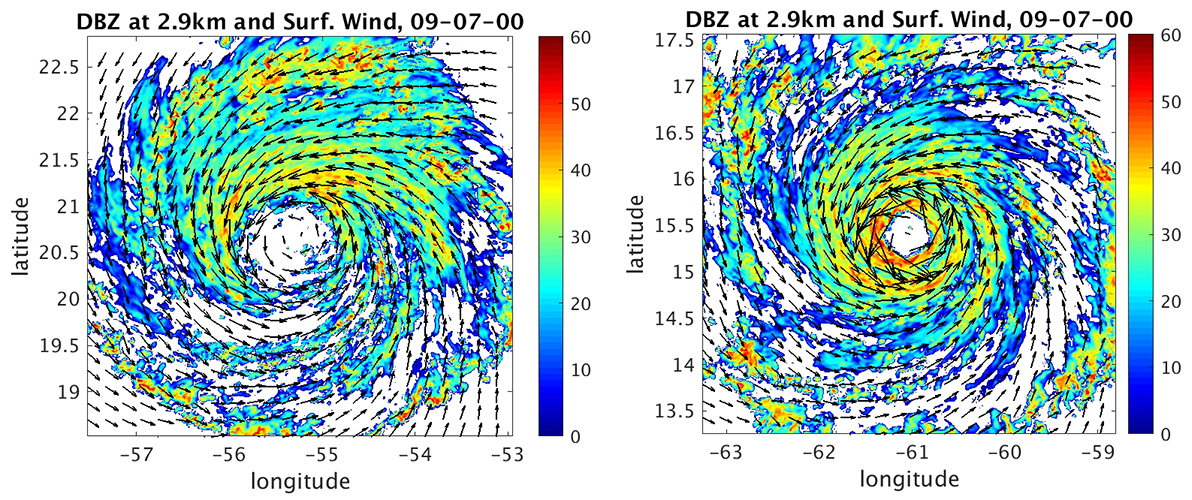
These are “idealized” hurricane embedded in zonal (east-west) flow in a tropical channel. Otherwise, they are closely modeled after the hurricane nature runs, using the same grid spacings, vertical levels, and physics. The initial conditions and ocean temperatures were selected to produce a large category 3 hurricane (Ideal3) and a small category 5 hurricane (Ideal5). The model output is saved every 30 minutes on all 4 grids (27/9/3/1 km). Surface fields were saved every 5 minutes for the 1 km grids.

Related publications:
Klotz, B. W., and D. S. Nolan, 2019: SFMR surface wind undersampling over the tropical cyclone lifecycle. Mon. Wea. Rev., 147, 247-268.
Nolan, D. S., Y. Miyamoto, S.-N. Wu, and B. J. Soden, 2019: On the correlation between total condensate and moist heating in tropical cyclones and applications for diagnosing intensity. Mon. Wea. Rev., 147, 3759-3784.
Large Eddy Simulations of Tornadoes
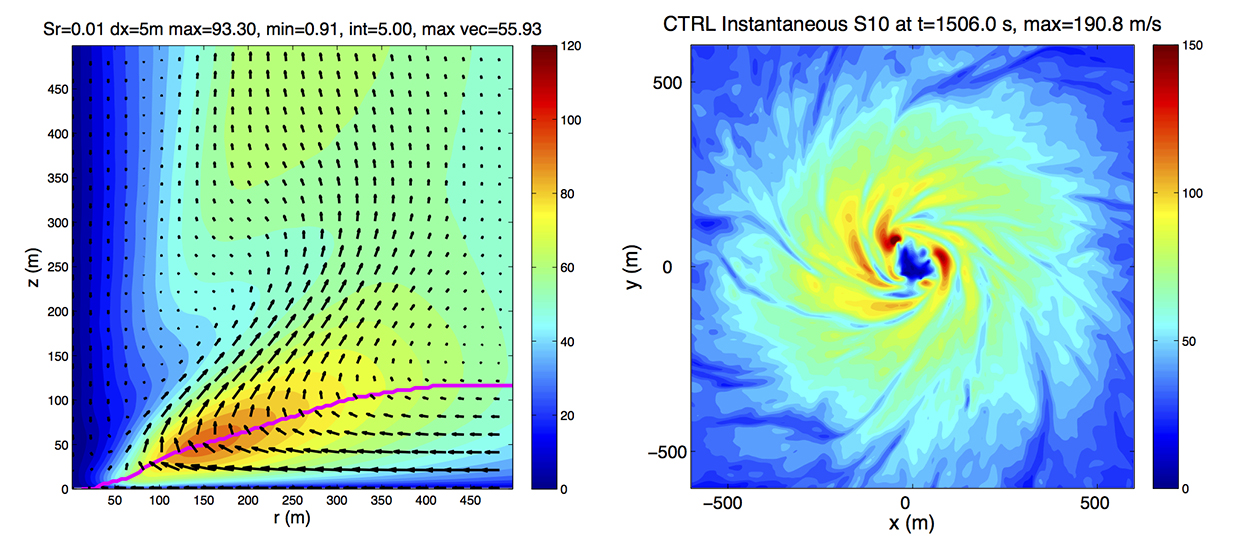
Working with George Bryan, Rich Rotunno of NCAR, and Nathan Dahl (now at U. Oklahoma), we generated a collection of very high resolution simulations of tornadoes interacting with the ground. Most of these simulations have 5 meter horizontal and 2.5 meter vertical resolution. For most we have low-level winds, from z = 1.25 meters to z = 11.25 meters, every 0.1 second, for 300 seconds. For some simulations we have complete 3D fields every 1 second, up to z = 500 meters, for 300 seconds (these data sets are very large). Some of the tornadoes are stationary, but some are translating at 5 or 10 m/s. These were produced with the model CM1 (https://www2.mmm.ucar.edu/people/bryan/cm1/) and are also in netcdf format.

Related publications:
Dahl, N. A., and D. S. Nolan, 2018: Using high-resolution simulations to quantify errors in radar estimates of tornado intensity. Mon. Wea. Rev.,146, 2271-2295.
Dahl, Nathan A., David. S. Nolan, George H. Bryan, and Richard Rotunno, 2017: Using high-resolution simulations to quantify underestimates of tornado intensity from in situ observations. Mon. Wea. Rev., 145, 1963-1982.
Nolan, David S., Nathan A. Dahl, George H. Bryan, and Richard Rotunno, 2017: Tornado vortex structure, intensity, and surface wind gusts in large-eddy simulations with fully developed turbulence. J. Atmos. Sci., 74, 1573-1597.
Bryan, George H., Nathan A. Dahl, David S. Nolan, and Richard Rotunno, 2017: An eddy-injection method for large-eddy simulations of tornado-like vortices. Mon. Wea. Rev., 145, 1937-1961.
Rotunno, Richard, George H. Bryan, David S. Nolan, and Nathan A. Dahl, 2016: Axisymmetric tornado simulations at high Reynolds number. J. Atmos. Sci., 73, 3843-3854.


